
Dr. S. K. Sharma, Retd. Member, Central Ground Water Board, GoI and Principal Advisor, India Water Foundation (IWF)
Ms. Shuchi Mishra, Engineer, WAPCOS Limited, Ministry of Jal Shakti
ABSTRACT
The application and use of Remote Sensing and GIS is very effective in water resources development and management projects. From point of view of targeting ground water with the use of RS & GIS techniques, four vital indices of analysis and interpretation of imageries have been used. These include indices of geomorphology and hydro-geomorphology, (ii) geologic structure, (iii) drainage indices, and (iv) geo-botanical indices for delineation of key-aquifers of alluvial and hard rock formations. Paper outlines the criterion to locate water wells in soft and hard rock regions. Case applications of regions is described. Remote Sensing based ground water exploration studies for Peninsular and Ganga -Yamuna regions is described.
1.0 Imagery based Indices of Analysis & Interpretation for Groundwater
1.1 Indices of Geomorphology and Hydro-geomorphology
Indices of geomorphology for detection of key-aquifers for alluvial areas include mapping of river-bed forms, alluvial terraces, alluvial fans, meandering and braided stream patterns, loosing and gaining reaches of streams, badland topographic areas, abandoned stream channels, channel-fills and swamp areas
Indices of hydro-geomorphology for detection of key-aquifers and ground water bearing prospecting horizons over hard rocks include mapping of vertical geological barriers (rock-dykes), weathering processes leading to development of pediments, buried pediments and pediment sloping plains.
1.2 Indices of Geologic Structure
Mapping geology and geologic structures have great bearing on the shape and the distribution of aquifers. Detection of fractured rock aquifers include mapping the orientation, frequency and density of joints and fractures and lineaments as well as orientation and pattern of dykes in relation to regional rock formation in an area. Fracture running parallel to country dykes and running oblique are identified. The underlying purpose of such mapping details is to identify and separate ‘open’ and ‘closed’ fracture systems. Fracture enlarged by drainage courses are open fractures capable of transmitting reasonable recharge to sub-terranean regions.
1.3 Geo-botanical Indices
Mapping of vegetation index and vegetation types and their affinity with lithology of rocks have also significant bearing on the presence or absence of ground water in an area. Mapped vegetation overlays are superimposed on morphological thematic layers for making deductions of vegetation influences of hydrologic processes contributing to ground water accretion in an area. Mapping of vegetation index and vegetation types and density of vegetation stands in forested watersheds using high resolution images offer opportunity for making estimates of interception losses of rainfall to underground water. Vegetation clusters have affinity with shallow ground water occurring as ‘springs” and with saline ground water occurring in coastal areas.
1.4 Drainage Indices
Morphometric analysis of drainage network yield information on catchment characteristics that influence run-off and base-flow in streams. It is worthy of mention that drainage density in an area is directly proportional to run-off generated in an area and bears inverse relation with permeability of rocks while infiltration numbers (drainage density times drainage frequency) have also direct bearing on rock permeability of an area.
2.0 Procedures and Methods used in the Study
These include:
- Application and use of Satellite &Aerial images
- Geomorphic parametric analysis and interpretation of images and topographic maps
- Application and use of Hydro-geomorphological maps and thematic layers
- Production and description of Imagery-based thematic layers of landuse-landcover, geology, drainage network, land facets and run-off producing areas and recharge zones
- Assessing of infiltration possibilities and ground water prospects of various land use and land cover categories derived from imageries.
- Finally demarcating feasible& prospecting areas for siting water supply wells and tube wells and observation monitoring wells
3.0 Imagery based Aquifer Detection Keys: Keys to the detection of aquifers with use of satellite imageries are based on shape, size, pattern signatures, outcropping rock types and folds and rock dykes are outlined in the table below:
Table 1: Aquifer Detection Keys
| S.No. | Remote Sensing Keys | Landscape units having bearing on Ground water occurrence |
| Shape or Forms | Stream valleysUnder-fit valleysBraided and meandering plainsAlluvial formsArc deltas(coarser materials)Levees(fine grained materials) | |
| Pattern | Drainage pattern(density/frequency)Snow melt: anomalus melting and green vegetation are areas of ground water dischargeElongated lakes, playas, ponds representing remanants of former stream valley: water bodies when superimposed with ground water table map yield information on a areas of recharge and dischargelinear ridges and linear drainage having structural controlsoil types and soil moisture zonesland use and land cover categories | |
| Outcropping Rock Types | LandformsShape of drainage basins/drainage patterns fracture types and symmetryOutcrop patterns | |
| Folds and Dykes | Folds and rock dykes to act as vertical geological barriers for movement of ground waterAsymmetric ridges and valleysSynclinal depressions |
- 4.0 Case Applications of RS & GIS based Ground water Exploration Areas:
These given as below:
4.1 Betwa-Yaumna Region:
Air photo-interpretation is a large scale mapping tool which aids in evaluating hydro-geological characteristics of fluvial terrain. Air photo-images provide perspective view of terrain at a glance and landform features having bearing on ground water occurrence are studied in relation to each other. Abandoned channels along Betwa and Betwa – Yumna river confluence, Swarnamukhi river and Sone river region in parts of UP,WB,MP and Odhisa states as potential areas for obtaining reasonably large supplies of ground water by means of tube wells are mapped and shown in fig1 to fig 3.
4.2 Ground water Targeting over Chittoor Region of Andhra Pradesh
A 400 sq.km area of Chittoor region of A.P. falling in Swarnamukhi river basin is studied. Landsat and CIR images are used in the study leading to evaluation of the role of remote sensing imagery data in targeting ground water occurrence. Also area selected for test borehole sites in hard rock region was achieved. Land use, land cover thematic maps and ground water data enabled preparation of resource characteristic map. Such map delineations yielded information on percent pervious and imperviousness and curve numbers for soil cover types for use in assessment of run-off.
The aerial and satellite images are ideal in locating structural and vegetative feature that influence ground water flow for suitably locating ground water exploratory well sites. The trellis drainage is a common feature controlled by rock fractures of granitic-gneissic rocks formation of the area. Photo morphic and morpho tectonic maps are ideal maps for locating ground water production well sites as shown in Figure 4 to Figure 6. Figure 5 and Figure 6depictthematic map layers of North Coimbatore (Kerala) and Karimnagar district of Andhra Pradesh.
4.3 Ground water Targetting Anantpur district area, Andhra Pradesh
The FCC imagery of Ananatpur area under study is at Fig 7. The satellite imagery derived geological map of Nalgonda area is at fig 8.The lineaments, rock dykes and water bodies are mapped on the imagery. It may be seen that such structures along with vegetation splotches, shown red in imagery have subtle control on the occurrence and availability of ground water in the area. Possible bore well sites have been located on imagery to enable users to test well drilling and designing of production wells for water supply purposes. The sites located have been verified in the field.
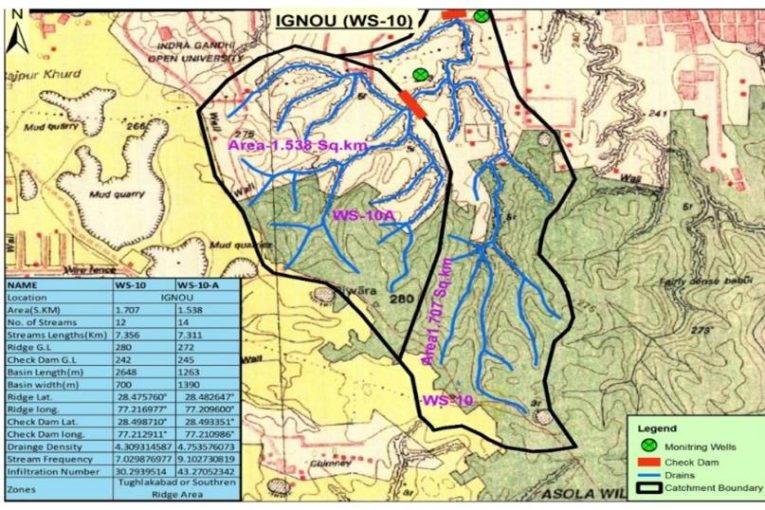
4.4 Delhi Ridge Area, NCT Delhi

Figure 9: Micro watershed Delhi ridge
A micro watershed map of Delhi Ridge area is developed for conducting morphometric analysis. The morphometric details are given as in- set in the map (Fig 9). The factor of drainage density and stream orders have helped locate sites for construction of small check dams. The storage pond behind check dams is to cause sub-surface infiltration to underlying fractured and jointed quartzite rock aquifer of the area. The farmer irrigation wells or any well located downstream of the check dam bund will provide improved well yield . The observation monitoring wells located at 100 and 300m distances from the check dam would need periodic monitoring of ground water level to assess ground water build- up over time in the area. Such check dams will have 2 to 3m height while located on stream widths of 10 to 20m.
4.4.1 Criteria to locating Check dam sites for Recharging Ground water in Delhi Ridge area
Delhi ridge area is rock watershed area and the hydrologic criteria determined to locating such sites as means of recharging ground water is described as below:
- Lanfacet Study: Mapping of weathered zone and delineation of pediment slopes and buried pediment surfaces
- Drainage Network: Mapping micro and mini-watersheds, drainage divides, drainage density and drainage frequency of watersheds including identification of perennial and seasonal streams
- Mapping Joints and fracture systems: Identifying linear fractures, fracture and joint intersections and fracture-controlled stream segments as infiltration areas
- Superimposition of GIS Thematic Layers: Superimposition of geomorphic layer, ground water table contour map and land cover layer and identifying the percolation zones as recharge areas.
4.4.2 Impact Analysis of Check dam storage pondage
After construction of check dams on 2nd and 3rd order streams flowing through Delhi Ridge areas, the following would need to be assessed:
- storage capacity of pondage area
- Number fillings caused annually in the pond
- Influence zone of Check dam pond
- Periodic monitoring of ground water build-up in monitoring wells located downstream of Check dams
5.0 Analysis of the impact of Hydro-geomorphological Maps(HGMs)
Impacts of HGMs are normally assessed as impacts caused by mapped and deciphered land forms such as paleo-drainage, inf-filled valley areas for alluvial aquifer regime, fractures and lineaments for hard rock regions, inter-dunal regions for desert environment aquifer and sandy beach ridge areas of coastal environments. Impact categories can be assessed by way of locating , drilling and testing production well structures for their yield and specific capacities as per following arrangements:
- Number of wells located on lineaments and at intersection areas of multitude of fractures occupying low relief areas
- Distance of wells from lineaments and their yield
- Wells located on paleo-drainage channels in river flood-plain areas
- Wells located in inter-dunal areas and in beach sandy areas
- Drilling and testing of wells for their specific capacities
6.0 Application and Use of Hydro-geomorphological Maps for Developing Drinking Water Supplies:
A hydro-geological map prepared by ISRO is placed at figure 10.Application and use of such maps is depicted by way of ground water development prospect that get yielded through analytical work on such maps with reference to ground work as shown in the table below:

Figure 10: Ground Water Prospects Map
6.1 Evaluation and tabulation of Ground water Prospect Area
| HGM units(land-facets) | Topographic forms | Landuse-Landcover | Feasible ground water structure | Ground water potential |
| Flood plain areas | Channel deposition,sand bars and meander soils | Sporadic Small vegetative covers | Hp/TW | Excellent |
| Abandoned stream channels | Coarse channel-fill deposit | Variably cultivated surfaces | Hp/TW | Excellent |
| Buried pediment surface | Weathered zone material amidst linear ridges from inselbergs | Variably vegetated | DW | Very good |
| Residual hills and Ridges | Rocky surfaces | Dense vegetation cover | Run-off generating areas | A contributing factor |
| In-filled valleys | Narrow valley segments | Coarser sediments and cultivable soils | BW/TW | Good to very good |
| Lineament/Fracture Zones | Linear fracture and multitude of fracture intersections | Vegetation occupying open joint and fracture spaces | BW/TW | Very Good to Excellent |
Note: BW= Bore Well: TW= Tube Well : Hp= Hand Pump : DW= Dug Well
7.0 Classification of mapped areas into erosional & Depositional Landforms
Various types of high resolution satellite images are used to map areas which get classified into erosional & depositional landforms.
- Accumulation landforms:
- Flood plain and abandoned river channels
- Infilled valleys
- Beach sand ridge areas
- Interdunal areas
- Erosional landforms:
- Linear ridges
- Residual hills
- Buried pediments
- Barrier dykes
- Structural landforms
- Trellis drainage
- Fracture/lineaments
- Mesa and Buttes
8.0 Summary
Analysis and interpretation of Satellite and Aerial Imageries together with field checks are essential back bones of targeting ground water in diverse hydro-geological environments. Synoptic over-views of terrains with use of hydro-geomorphological maps especially the morphology and land use-land cover thematic layers are reliable sources of information which make it possible to locate possible production well and tube well sites to yielding sustainable water supplies.
Examples for alluvial and hard rock regions are discussed to help planners and managers of ground water to make use of subtle tools of RS& GIS methods described for ground water prospection.
In summary, ideal and sustainable ground water prospection must be based on evaluation of ground water aquifer characteristics founded on the interpretative use of RS & GIS based hydro-geomorphological thematic map layers within the frame-work of climatic conditions of areas.
References
- ‘Ground Water Prospection in Hard Rock regions’ under the Journal of Centre for Ground Water Studies, ISSN:2347, Vol XIII(http://www.cgwskolkata.com/groundwater-journal.html)
- PhD thesis: “Remote Sensing and GIS on Ground water Exploration”, by Dr. S. K. Sharma, 1996
- Oyedele, A.A. Use of remote sensing and GIS techniques for groundwater exploration in the basement complex terrain of Ado-Ekiti, SW Nigeria. Appl Water Sci 9, 51 (2019). https://doi.org/10.1007/s13201-019-0917-9