Large new study crunches decades of IMD data to unpack patterns of warming — and some cooling — across India, points to impact on agriculture in a country with 17.5 per cent of world’s population but only 2.4 per cent of its area.
 A new study that used comprehensive surface temperature data to record changes in daily mean temperatures across India over seven decades has found “a consistent pattern of warming” over the northwestern and southern parts of the country from the 1950s to the 2000s, even as the “broad zone anchored over northeastern India and extending southwestward across central India” saw “a pattern of cooling” during this period.
The results, published recently in Scientific Reports, a journal of the Nature group, have been reported by Robert S Ross and T N Krishnamurti of Florida State University, Sandeep Pattnaik of IIT-Bhubaneswar, and D S Pai of the India Meteorological Department. The study has examined the patterns in the overall warming of the planet that has accelerated since the 1950s, and its possible impact on Indian agriculture. (‘Decadal surface temperature trends in India based on a new high resolution data set’: Scientific Reports 8: 2018)
What is the key finding of the study?
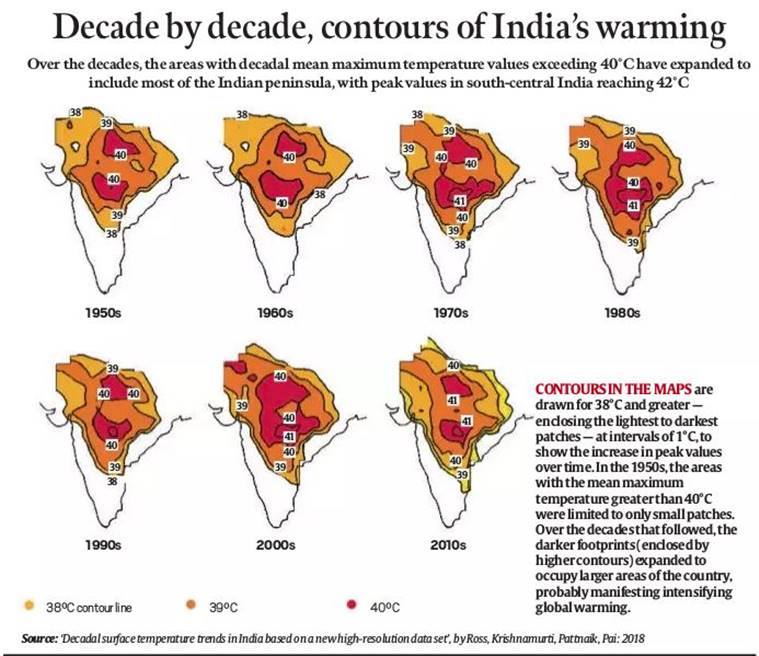
Essentially that while the “decade mean maximum surface temperatures over India in the pre-monsoon months in the 1950s showed limited areas with values as high as 40°C”, by the 2010s, the “area with values exceeding 40°C had expanded to include the majority of the Indian peninsula, with peak values in south-central India reaching 42°C”. At the same time, there is “a definite, and somewhat surprising, cooling (or in some instances, reduced warming)” in the Northeast over these decades — a pattern of warming and cooling that is explained by “the presence of a large region of anthropogenic brown haze over India and the adjacent ocean regions”, especially in the winter and spring. “The haze”, the researchers say, “is composed of aerosols that absorb solar radiation, which reduces insolation at the Earth’s surface leading to cooling, while increasing absorption in the aerosol layer leading to warming”.
On what data is the study based?
An examination of all-India surface mean temperature anomalies for 1901-2016 reveals an “unmistakable rapid rise, particularly since about 1980, as seen in annual, winter, pre-monsoon, monsoon and post-monsoon period depictions”, notes the study. Beginning from this observation, the researchers focussed on a recently developed comprehensive surface temperature data set for India for 1969-2005, a range that was subsequently expanded to 1951-2013. Temperature data from 395 Indian meteorological stations were categorised into the periods April 1-May 31 (pre-monsoon), July 1-September 30 (monsoon), and January 1-March 31 (winter), for which researchers looked at the maximum, minimum and daily mean temperatures.
And what do the data suggest?
In the 1950s, the area with a mean maximum temperature higher than 40°C was small — only one spot in south-central India showed values ~ 41°C. “The region with values greater than 40°C begins to expand in the 1970s and 1980s and (that) with values greater than 41°C in south-central India enlarges”, says the study. A very slight fall is seen in the 1990s, and then, “the region with temperatures greater than 40°C expands dramatically in the 2000s and the 2010s, (that) with temperatures greater than 41°C expands, and a region with temperature greater than 42°C appears in south-central India in the 2010s”. Also, a notable warming trend that begins in northwestern India in the 1970s, accelerates in the 2000s ad 2010s. The broad conclusion: “These decadal mean temperature patterns suggest that global warming is manifesting itself over parts of India in the maximum temperatures observed during the warm pre-monsoon period, with an accelerating pace noted, particularly in the last two decades.”
What do these findings imply?
India, the researchers underline, is “more vulnerable to climate change because its agricultural system must feed 17.5% of the world’s population with only 2.4% of the land and 4% of the water resources of the planet”. A mid-range projection of climate change for 2020-39 has indicated a reduction in crop yields of between 4.5% and 9%, the study says. One point of comfort: maps of multi-decadal temperature change show that the primary rice- and sorghum-growing regions “lie directly in the swath of multi-decadal temperature cooling (or reduced warming)”, which may indicate relatively “less stress” for these “critical growing areas